Stories of Lake Simcoe
Stories of Lake Simcoe
Science to Action
From Beaverton to Barrie, Udora to Aurora, Hawkestone to Holland Landing, the Lake Simcoe watershed is home to many – our lives and that of its plants and animals rely on its health.
In this series of stories, you’ll have the chance to learn about our watershed’s precious ecosystem and how changes on the land and in the water impact its health. You’ll also get a behind-the-scenes look into our work monitoring and restoring the watershed.
Uncover the trends and get to know the lake and land you call home.
Stories of Lake Simcoe – Storymap Series
Because watershed health is dependent on many factors, our monitoring programs must take a holistic approach. This means we look at numerous parameters and how they interact and impact each other.
As you scroll through this storymap, you’ll see some highlights from our monitoring and restoration work. Some stories also include a link to “Explore the Watershed” where you’ll be able to view water quality indicators such as phosphorus, chloride and sediment concentrations.
Whether you’re new to the watershed or have lived here your entire life, you may have noticed changes to the lake, local rivers, your property or in your town. Read the stories behind our science, the trends, and your role in caring for the place you call home.

Questions, comments or feedback? Send us a note! Looking for a text-only version? Read it here!
How to Use this Storymap
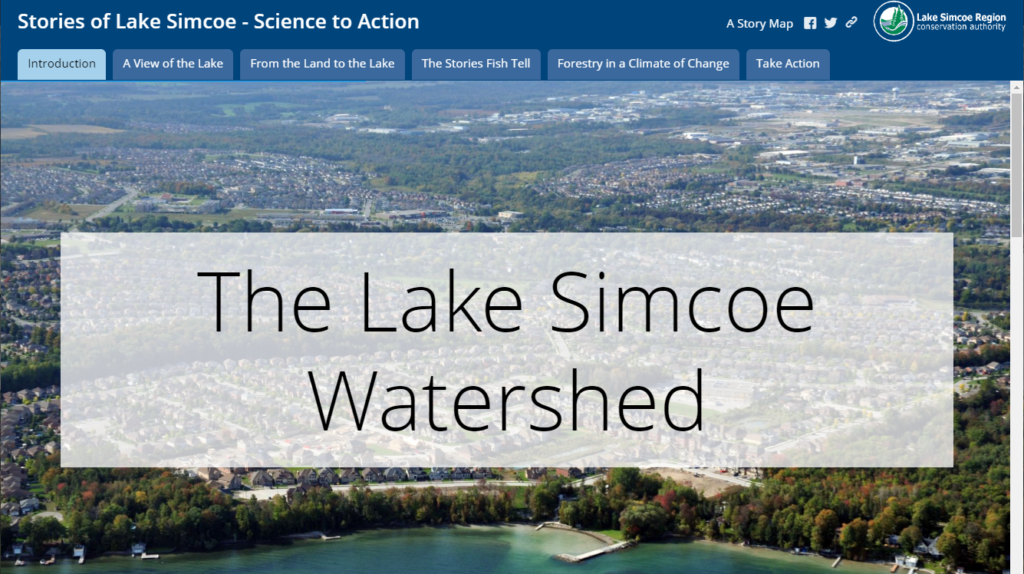
When you click the storymap link, you’ll see a landing page that looks similar to a website. Each tab along the top in the navigation will bring you to a series of stories that includes animations and maps.
When you select a story and start scrolling, you’ll see a series of links appear at the top right. Keep scrolling down to view the entire story, or use these links to navigate to a specific story of interest.
In the “From the Land to the Lake” stories, you’ll see links embedded throughout titled “Explore the Watershed.” This link will open a new window with a dashboard viewer that allows you to see the selected indicator – phosphorus, chloride and sediment concentrations or brook trout biomass – by subwatershed. When using the dashboard, you can click a point on the map to find out the station name and then use the drop-down menu on the top right to adjust the chart view.
Need some help? Send us an email or give us a call at 905-895-1281.
