![]() Who to Contact
Who to Contact
Integrated Watershed Management
✆ 905-895-1281
✆ 1-800-465-0437 Toll free  info@LSRCA.on.ca
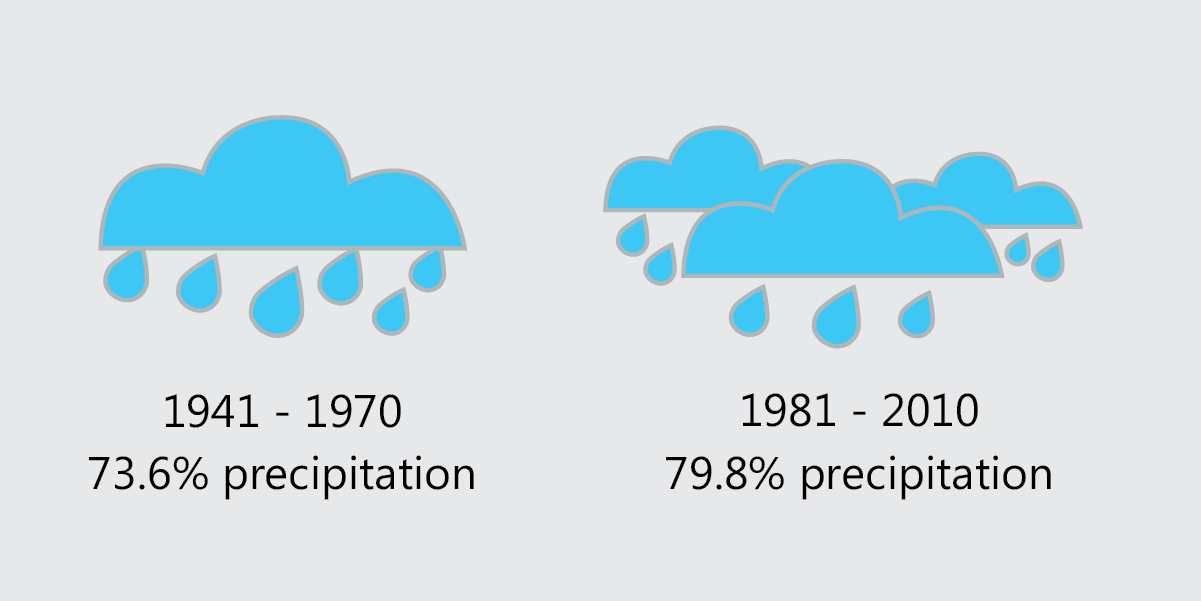
![]() Climate Change Resources
Climate Change Resources
![]() Lake Simcoe Sessions Podcast
Lake Simcoe Sessions Podcast
Join us for an audio learning journey, where you will have the chance to hear how climate change is impacting us locally, here in the Lake Simcoe Region.