Climate Change Adaptation Strategy
Watershed Trends and Projections
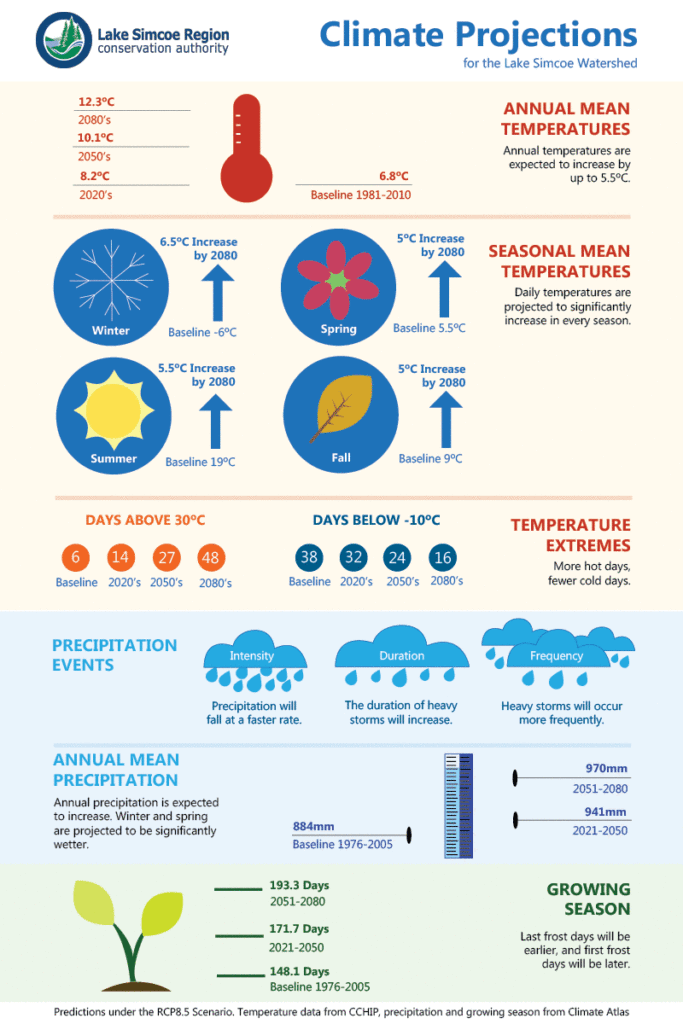
Take a look at the trends and projections for the Lake Simcoe watershed in this infographic (or scroll down to read the text version).

Annual Mean Temperatures
Annual temperatures are expected to increase by up to 5.5ºC.
- Baseline 1981 to 2010 – 6.8ºC
- 2020s – 8.2ºC
- 2050s – 10.1ºC
- 2080s – 12.3ºC
Seasonal Mean Temperatures
Daily temperatures are projected to significantly increase in every season.
Projected increase by 2080:
- Winter (baseline -6ºC) – 6.5ºC
- Spring (baseline 5.5ºC) – 5ºC
- Summer (baseline 19ºC) – 5.5ºC
- Fall (baseline 9ºC) – 5ºC
Temperature Extremes
More hot days, fewer cold days.
Days above 30ºC
- Baseline – 6
- 2020s – 14
- 2050s – 27
- 2080s – 48
Days below -10ºC
- Baseline – 38
- 2020s – 32
- 2050s – 24
- 2080s – 16
Precipitation Events
- Intensity – Precipitation will fall at a faster rate.
- Duration – The duration of heavy storms will increase.
- Frequency – Heavy storms will occur more frequently.
Annual Mean Precipitation
Annual precipitation is expected to increase. Winter and spring are projected to be significantly wetter.
- Baseline 1976 to 2005 – 884mm
- 2021 to 2050 – 941mm
- 2051 to 2080 – 970mm
Growing Season
Last frost days will be earlier, and first frost days will be later.
- Baseline 1976 to 2005 – 148.1 days
- 2021 to 2050 – 171.7 days
- 2051 to 2080 – 193.3 days
![]() Who to Contact
Who to Contact
Integrated Watershed Management
✆ 905-895-1281
✆ 1-800-465-0437 Toll free 
Climate Change Adaptation Stategy
Water Quality in our Rivers and Streams
Water Quantity
Stream and River Ecosystems
The Lake Ecosystem
Terrestrial Natural Heritage
Watershed Trends and Predictions (Infographic)
