
Lake Simcoe Science
Testing the Waters with Innovative Monitoring
Improving Phosphorus Monitoring in Streams and Rivers
Phosphorus is an essential nutrient for living things. In nature it is found in small amounts, where it is needed for processes such as plant growth. When a little extra phosphorus is added to an ecosystem (think of fertilizing a garden), it helps plants grow. However, too much phosphorus is not good and causes excessive plant growth, on land and in water.
As described in previous Science newsletters, Lake Simcoe has a problem of too much phosphorus. This has led to increases in algae, increases in aquatic plants, and a corresponding decrease in deep water oxygen (when the plants die, they take away oxygen). This, in turn, has negatively impacted cold water fish such as lake trout and lake whitefish. Reducing phosphorus is essential to a healthy lake.
We know that most of the phosphorus (about 60%) enters the lake from its tributaries (rivers). We know this through our sampling program and we are continually seeking ways to improve on our data collection methods as well as increasing our understanding of phosphorus behaviour in the tributaries.
This newsletter is about the results of a pilot project we started in 2011 to enhance our phosphorus data collection and better understand phosphorus characteristics in Lake Simcoe tributaries.
The Forms of Phosphorus
In water, phosphorus has two main forms – dissolved (soluble) and particulate (attached to or a component of particulate matter). When added together, you get a measurement of total phosphorus (TP). The target concentration of total phosphorus in rivers is 0.03 mg/L to avoid nuisance plant and algae growth.
Dissolved phosphorus is quite literally dissolved in the water, much like salt. This type of phosphorus is not attached to a particle and can pass through filters. It is the form most easily used by plants or algae. It is therefore considered more “bioavailable” than particulate phosphorus.
Particulate-bound phosphorus is attached to suspended particles in the water such as minerals or algae. This type of phosphorus can be collected on a filter. Many tributaries of Lake Simcoe have a “cloudy” or “turbid” appearance because of those suspended particles, much of which can contain phosphorus.
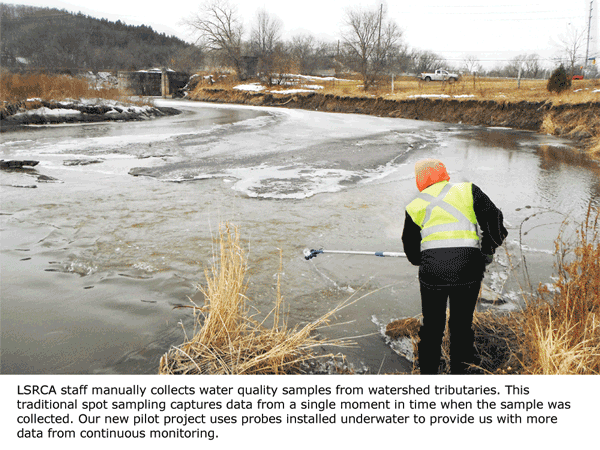
Spot Samples vs. Continuous Sampling
LSRCA researchers collect tributary water samples – one sample every two weeks at 31 different locations – to test for phosphorus and various other factors. We’ve been doing this for many years and have data at some sites dating back to the 1970s.
While this spot sampling method is informative and has provided the basis for our understanding of phosphorus entering Lake Simcoe, it’s not without its own issues. For one, it can get quite expensive because of the manual labour involved in collecting the samples and the fact that the samples have to be analysed by an external laboratory.
Another drawback of spot sampling is that each sample represents a single moment in time – when that actual water sample was collected. However, rivers are dynamic and a single sample cannot account for the changes in phosphorus concentrations that happen during storms or droughts or as a result of other biological activity. We could try and offset this by collecting more samples, but then we’d run back into the issue of the cost. Ideally, to track all these changes in concentration, we would like to automate sample collection and collect them more often – hourly or even more often. That’s where turbidity comes in.
Turbidity’s Relationship to Phosphorus
Turbidity is a measure of the amount of material suspended in water. This suspended material can include soil particles (clay, silt and sand), algae, plankton, microbes and other particulate substances. These particles enter a tributary through a variety of ways … by eroding stream banks or soils or run-off from paved surfaces in urban areas. A stream that is normally clear can have high levels of turbidity during rain storms because that’s when the soil is “scoured” from unprotected fields, unstable stream banks and nonporous surfaces into the stream.
Turbidity is measured by determining the amount of light that is reflected off particles in a water sample. Because particles in water can contain phosphorus, by measuring turbidity, we can estimate how much phosphorus is being transported in a tributary.
Baseflow vs. Storm Event Flow at Kettleby Creek
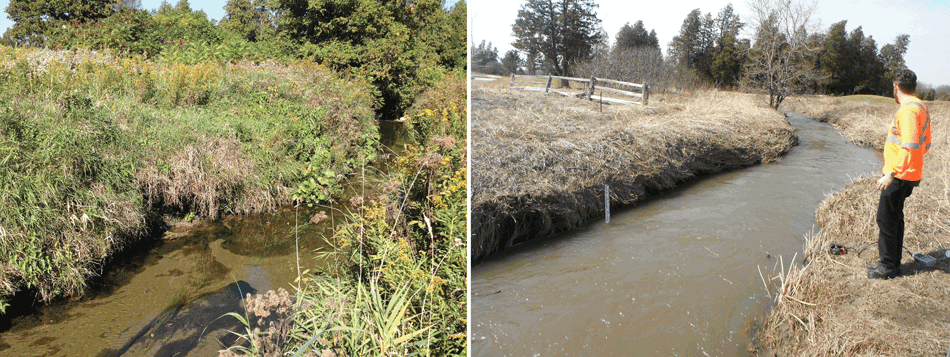
Above left is Kettelby Creek under baseflow conditions; note the clarity of the water. Above right is the same stretch of the creek during a storm event. The turbidity of the water is due to the higher water levels, water velocity and particulate washed off the catchment into the creek during the event.
East Holland River Sample Concentrations
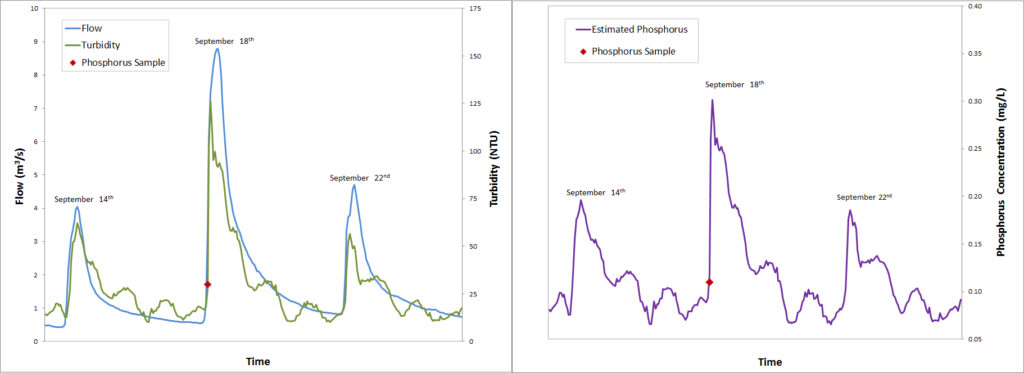
The graph on the left shows three storm events in September 2012. Station data, shows the river flow (blue) increases during each event. New underwater optical probes show us that turbidity (green) also increases. The traditional spot sample alone (red point), taken at the beginning of the event, does not provide enough information to effectively measure the water quality during the high flow event. Using the turbidity data measured every 15 minutes we can estimate phosphorus concentrations (purple, right graph) for these three events, which provides a more accurate picture of water quality for that period of time.
Better Monitoring through Technology
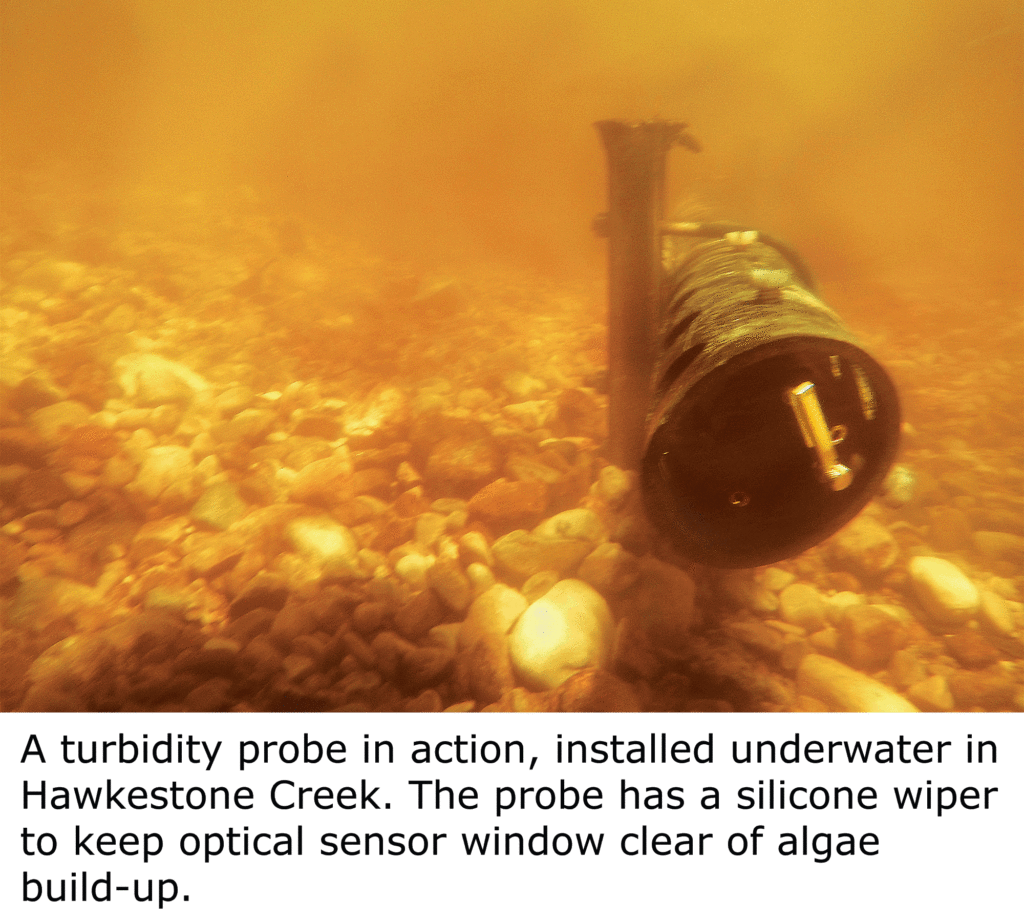
While we need a laboratory to analyse how much phosphorus is in a water sample, another method of calculating phosphorus is to study its relationship to turbidity. We can do this through the use of permanent optical probes installed in the river that can take frequent measurements of turbidity.
The pilot project gave us the opportunity to install four permanent optical probes, which take frequent measurements of turbidity, at test locations throughout the watershed to evaluate the effectiveness of using turbidity to estimate phosphorus.
Using the spot sampling method, LSRCA typically collected 26 samples per year at each sampling station. But using the continuous monitoring turbidity probes(which collect data every 15 minutes), we were able to collect 35,040 measurements per year at each station. These measurements are being used to fill in the gaps inherent to in the spot sampling method and will help us improve phosphorus load calculations, understand phosphorus dynamics, identify phosphorus contributions from various land use types, or evaluate best management practices.
What is a Concentration and a Load?
A water quality sample result is expressed as a concentration, that is a mass (milligrams or mg) in a given volume of water (litre or L) typically as mg/L.
A load in a river is a mass of material transported by that river over a given period of time, such as 44 tonnes per year of phosphorus.
To calculate a load (of phosphorus or P), we need to know the concentration (mg of P/L) and flow rate of the river (volume& of water (L) over time (sec)). Then load equals concentration times flow.
What We’ve Learned
We selected four test locations to compare results under different circumstances and with different land uses around them – different land uses influence turbidity and phosphorus concentrations, but can also influence the strength of the relationship between the two.
The sites we chose included the East Holland River, the Beaver River, North Schomberg and Hawkestone Creek. The East Holland River is a large tributary with a lot of urban area, specifically Aurora and Newmarket. The Beaver River runs through a largely agricultural area. North Schomberg is a small subwatershed that is heavily influenced by a large highway. And Hawkestone Creek is the most natural catchment with some of the best water quality in the watershed.
The results told us that the best relationship between turbidity and phosphorus was at our East Holland River site. This is very useful to know since the East Holland River is one of the largest contributors of phosphorus to Lake Simcoe. A better understanding of phosphorus dynamics at this location allows us to make more accurate phosphorus load calculations and have a better understanding of what transports phosphorus in the river (storms, seasonal changes).
At the Beaver River site, we found a different pattern. While turbidity and phosphorus concentrations rise in relation to the water levels during a storm, the turbidity and thus phosphorus concentrations decrease faster than the water levels as they subside. From this, we know that to improve phosphorus load calculations for this tributary, we need samples collected before, during, and after a storm event in order to capture the phosphorus fluctuations.
Another advantage is that the turbidity probes are essentially always sampling – 24 hours a day, 7 days a week. Spot sampling at Hawkestone Creek only gave us 26 opportunities in a selected 8-month period of 2012, to see if the 0.03mg/L guideline was exceeded. From these samples we saw two exceedances of the guideline. However, the probes showed us there were actually 19 exceedances with concentrations elevated above the guideline for a total of 16 days.
Challenges
There are some rivers where turbidity probes won’t work. For example, in the West Holland River, we know that there is a higher proportion of dissolved phosphorus in the water, which makes for a poor turbidity-phosphorus relationship.
Other challenges include probes getting damaged, access to probes during winter or probes freezing. Ironically, one of the greatest challenges stems from one of its benefits – the volume of samples that a probe can collect. Having all this data requires resources to analyze it.
Probes will not replace conventional sampling outright (we will still need the sample data to calibrate and correct probe readings) but probes can be used to augment conventional sampling and fill in gaps that would otherwise be missed.
Innovation at LSRCA
The Turbidity Probe Project is just one example of how LSRCA is constantly finding, evaluating and applying new, innovative technologies and techniques that can help us to better understand, protect and restore Lake Simcoe and its watershed.
Contact Customer Service:
Phone: 905-895-1281
Toll Free: 1-800-465-0437
Email: info@LSRCA.on.ca
This newsletter was published in Lake Simcoe Living Magazine in 2016.