GIS – Everywhere you are
Every day, decisions are being made with information provided by GIS. From predicting weather, to identifying flood prone areas, to analyzing crime patterns, to deciding where to locate facilities like shopping malls, GIS plays a role because these geographic problems require spatial thinking.
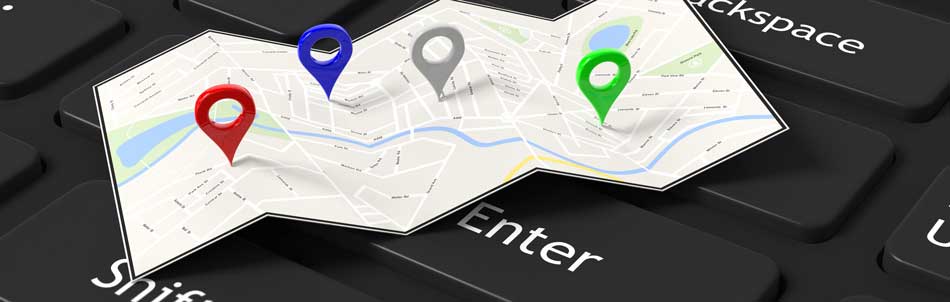
You probably use GIS every day and don’t even realize it. When you open the map tool on your phone to find out where the closest Tim Hortons is, or look up the movie theatre schedule, GIS is running behind the scenes making that information available at your fingertips. School boards use GIS to map their bus routes. Municipalities use it to track their snow plough routes. Real estate agents use it to help find the perfect home for their clients. If you’re searching for something, GIS can probably help. But don’t expect it to help when you lose your glasses… at least not yet!
Supporting decision making
GIS refers to the systems that support all the knowledge we have at LSRCA.
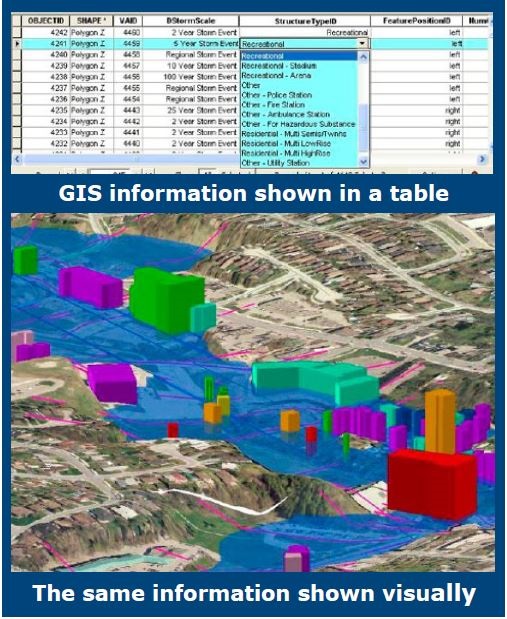
By taking data from tables and displaying them on a map, GIS supports informed, knowledgeable decision-making that encourages participation and understanding. GIS also provides the infrastructure support that houses all this information. Without GIS, tasks that now take minutes or even seconds, would have taken hours, days or even weeks.
If a picture is worth a thousand words, then GIS is probably worth a million.
The data iceberg
Maps are one product of what GIS can do, but a lot of data collection, analysis, review and management is required to make that map. It would be an oversimplification to equate GIS with maps. The map is only the tip of the iceberg. There’s a lot going on behind the scenes (under the water) that is not readily apparent.
GIS at LSRCA
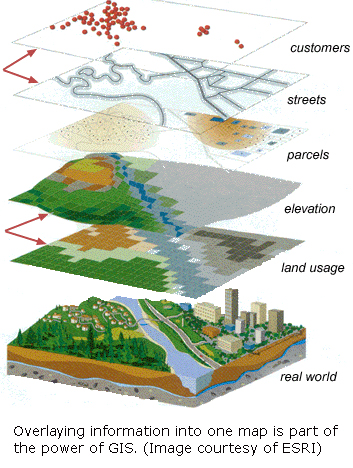
By plotting information on a map in layers, we can see how they interact or intersect with one another. Like chapters in a book, the layers add up to tell us a story. We can see the full picture of the landscape and inform such decisions as where we should or shouldn’t develop.
Our GIS department has access to hundreds of layers (types) of information that contributes to our understanding of the landscape.
We only scratched the surface of the topic of GIS in this issue. In the next newsletter, we delve deeper into how GIS operates specifically at LSRCA.
Who to Contact:
Customer Service
Phone: 905-895-1281
Toll Free: 1-800-465-0437
Email: info@LSRCA.on.ca